New Features
Incident Graphs Make Driver Coaching Even More Effective
December 12, 2018

Get the latest from Samsara
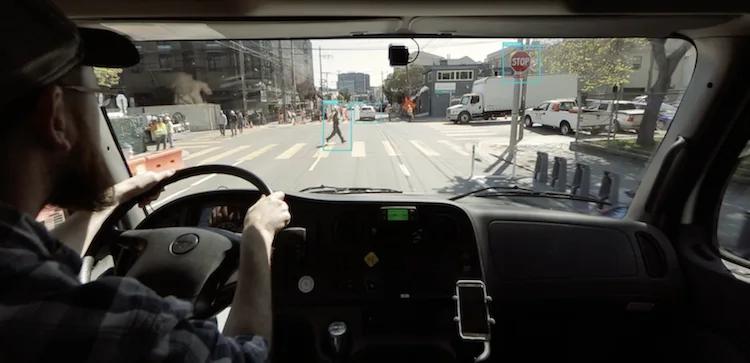
Subscribe nowToday Samsara is adding incident graphs to harsh event videos. Now, when you review incident footage, you’ll see a detailed graph with second-by-second data for speed and, for select makes and models, accelerator pedal, braking, and cruise control usage.
Incident graphs offer added context about why and how an incident occurred, which makes driver coaching sessions even more productive. For example, if Samsara detects a harsh braking event, the incident graph shows exactly when the brake pedal was pressed and how much the driver had been accelerating leading into the event, which can help coaches provide more specific feedback. If a driver regularly speeds, a manager can easily see when cruise control was in use and encourage the driver to use cruise control on highways to avoid speeding. We currently support speed data for all vehicles, and we are quickly expanding accelerator pedal, braking, and cruise control support for newer makes and models.
If you are a current Samsara dash cam customer, you can access incident graphs today in your dashboard. Simply click any incident, and you’ll see the graph below the video footage. We’ll be rolling out incident graphs in the next few weeks for customers without dash cams.
If you are in the market for a fleet safety solution or are in the process of implementing in a fleet safety program, reach out for a live demo of our new incident graphs or try it yourself for free.
Get the latest from Samsara
Subscribe now