Data Insights & Analytics
3 Ways The 2020 Holiday Shopping Surge is Impacting U.S. Fleets
December 10, 2020

The holidays are always a busy time for logistics companies. Labor Day, Black Friday, Cyber Monday, Hanukkah, Kwanzaa, and Christmas all fall within a four-month period of increased shopping (and shipping) at the end of the year. But this year will be unlike any we’ve seen before.
The COVID-19 pandemic has shifted how Americans are shopping, causing a surge in e-commerce and shipping of goods purchased online. Despite an uncertain economy, almost three-quarters of consumers (73%) said their overall holiday spending will either stay the same or increase this year. Furthermore, Deloitte has forecasted that e-commerce sales will grow by 25% to 35% compared to last year.
For U.S. supply chains, this could mean a surge in shipping demand. Many fleets have already made changes in anticipation of the holiday season. For example, Schneider National, the fifth largest trucking company in the U.S., is increasing its pay for truck drivers and offering bonuses to attract driver talent. Others, like TCI Transportation, are hiring additional personnel to meet demand and keep their drivers safe.
To see how this year’s holiday shopping surge is impacting fleets across the U.S., we analyzed data from a sample of 3,676 commercial fleets in three key industries that support holiday shopping—food and beverage, transportation and warehousing, and retail—representing nearly 80,000 vehicles taking more than 110 million trips. For more information on how we conducted this analysis. Read on to learn more about our findings, including how this year compares to last, which weeks are busiest, and why we’re predicting a spike in speeding on Christmas.
Key findings
Heading into the holiday season, drivers are busier than ever and speeding has increased. Overall, 2020 has been busier than 2019 for fleets in the food and beverage, transportation and warehousing, and retail industries. Across these industries, fleets are driving about 10% more miles per day compared to 2019, with only about 5% more vehicles on the road. This means vehicles are driving more miles on average this year—and drivers are busier than ever. Furthermore, as commercial activity has increased, so has speeding. Heavy and severe speeding (11 MPH or more over the speed limit) rose 20% above the pre-COVID-19 baseline in April, and we’ve seen this trend persist throughout 2020.
For fleets in these industries, the weeks leading up to Thanksgiving and Christmas are the busiest. Last year, there was a 5% increase in miles driven the week leading up to Thanksgiving 2019, followed by a dip the week of the holiday, and then a 6% increase leading up to Christmas 2019. This year, we saw a 5% increase in miles driven the week leading up to Thanksgiving 2020, and we expect a similar (if not bigger) increase in miles driven this December as fleets rush to meet the Christmas surge.
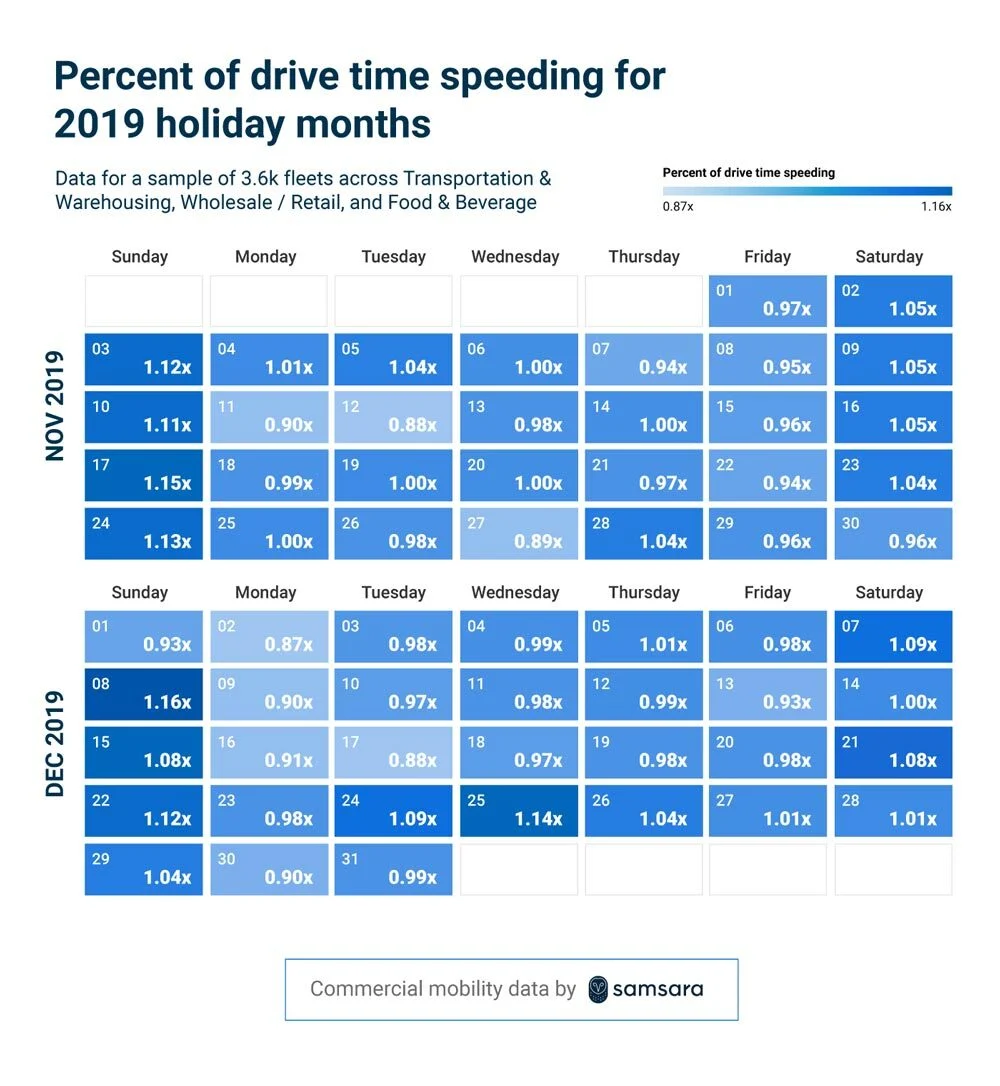
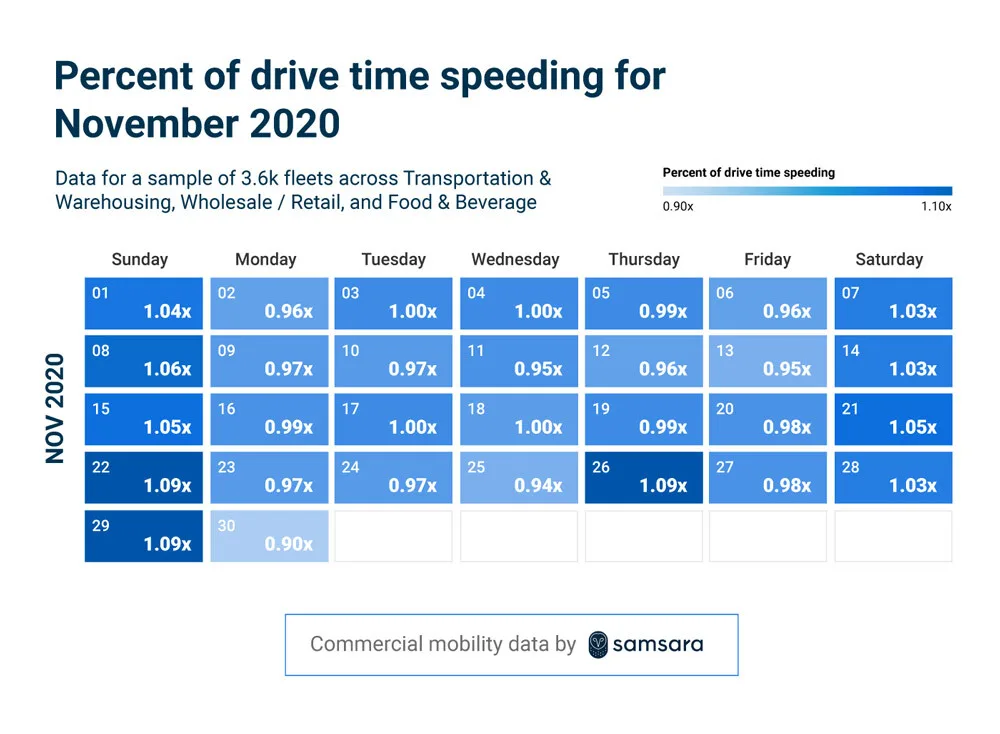
Speeding tends to spike on holidays, and we predict it will spike again this Christmas. Our data shows that the days most prone to speeding are the holidays themselves, likely due to emptier roads. In 2019, speeding was 4% higher than average on Thanksgiving day and nearly 15% higher on Christmas day. This year, speeding was 9% higher on Thanksgiving day (more than double the increase on Thanksgiving day last year), and we predict that speeding will spike again on Christmas day this year.
<div id="section-1">1. Heading into the holiday season, drivers are busier than ever and speeding has increased</div>
At a macro level, Samsara data shows that 2020 has been busier than 2019 for fleets in the food and beverage, transportation and warehousing, and retail industries. Across these industries, we’re seeing fleets drive about 10% more miles per day in 2020 compared to 2019, while the number of vehicles on the road has increased half that amount (5%). This means that overall, average daily miles driven per vehicle has increased in 2020, after a slight dip in March through May (likely due to COVID lockdowns).
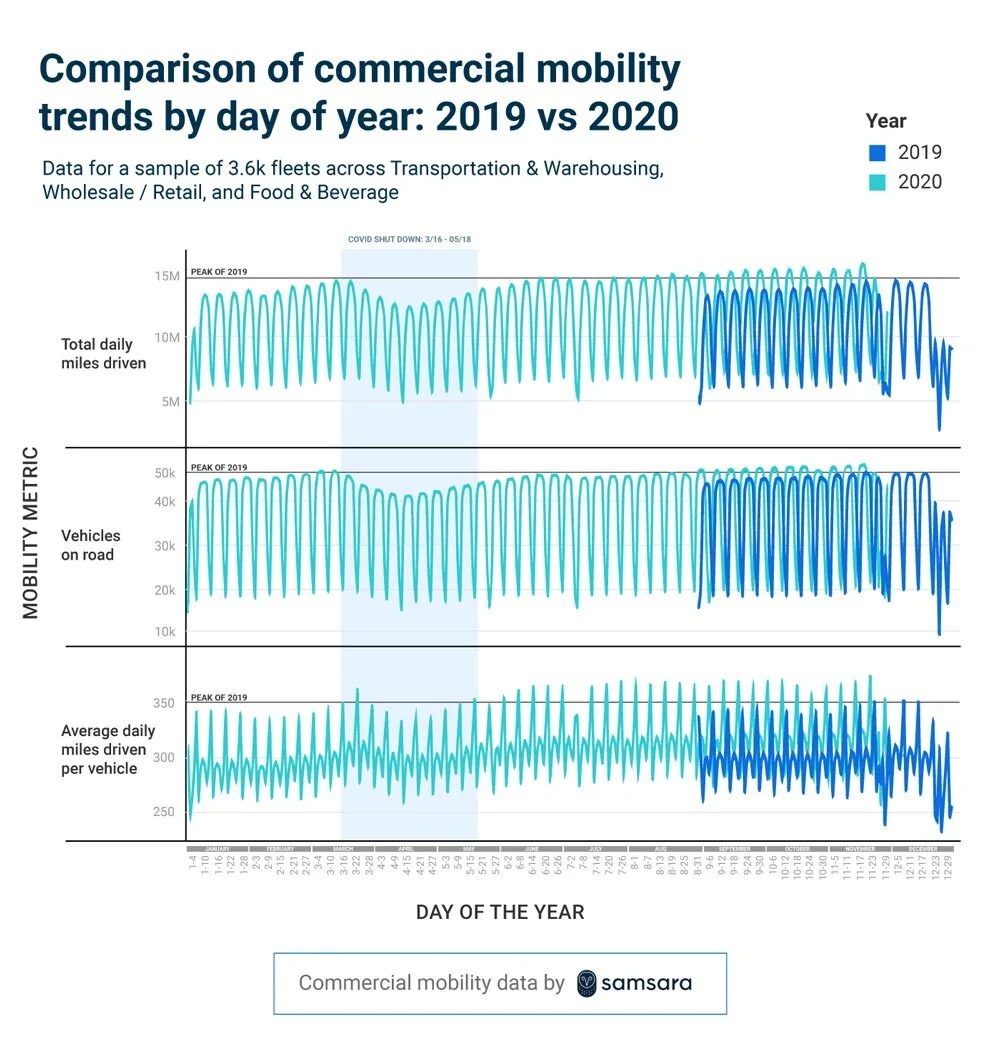
This increase in average daily miles driven per vehicle in 2020 means fleets are doing more with less, and drivers are busier than ever. A number of factors could be influencing this trend, including:
Increased consumer spending: U.S. consumer spending on goods increased 7.2% from January to September of this year. As the New York Times reported, “With nowhere to go during the pandemic, Americans are buying more stuff than ever.”
More reliance on e-commerce: Even before the COVID-19 pandemic hit, e-commerce was booming. Now, with more consumers ordering goods from the safety of their own homes (rather than shopping in-person), shipping demand is surging beyond some carriers’ capacity.
Hesitance to invest in more vehicles: While the COVID-19 pandemic has led to an increase in demand for some consumer goods, it has also created uncertainty: will increased demand continue, or is the trend specific to 2020? As a result, some businesses have invested less in additional vehicles (a large fixed capital investment) to meet demand, and have instead opted to use their existing vehicles more extensively or hire additional drivers.
Los Angeles-based carrier TCI Transportation, a Samsara customer, has experienced this 2020 increase in demand firsthand.
“After April this year, we have seen a steady but strong increase in demand for our services as we are heavily involved with retail, grocery, and e-commerce,” said Ryan Flynn, President of TCI Companies. “Amazon Prime day falling later in the year blended into traditional fourth quarter high demand. We are responding by adding recruiters and safety personnel so we can keep up with adding safe drivers to the team.”
Of course, it’s possible this trend could shift course, especially if additional lockdowns are enacted this winter. When COVID-19 lockdowns were first put in place throughout much of the country in March through May, we saw a 10-15% decline in driving activity. It’s possible that new lockdowns could lead to similar decreases. However, it’s unclear how this would play out if lockdowns are enacted at the same time as the holiday shopping surge.
Furthermore, as commercial activity has increased across these industries this year, so has speeding. In June, we published a data analysis revealing that emptier roads due to COVID-19 have resulted in a 20% increase in heavy and severe speeding (11 MPH or more over speed limit). Five months later, we’ve seen this trend persist throughout 2020—with 18% more heavy and severe speeding on average in September and October of this year compared to the same period last year.
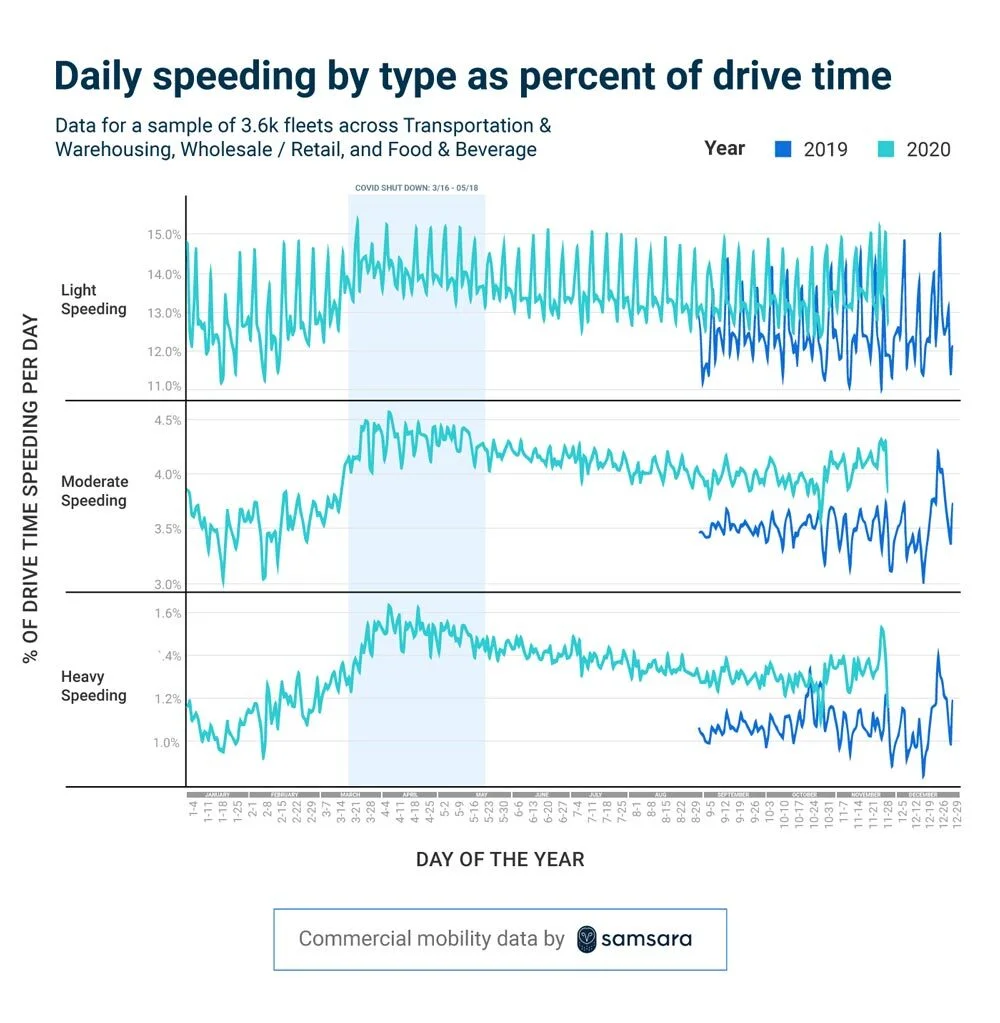
Our hypothesis? This 2020 increase in speeding is likely caused by emptier roads due to COVID-19. This trend could become even more apparent as we approach Christmas, since our data shows that speeding tends to spike on holidays (read more on speeding trends.
<div id="section-2">2. For fleets in these industries, the weeks leading up to Thanksgiving and Christmas are the busiest</2>
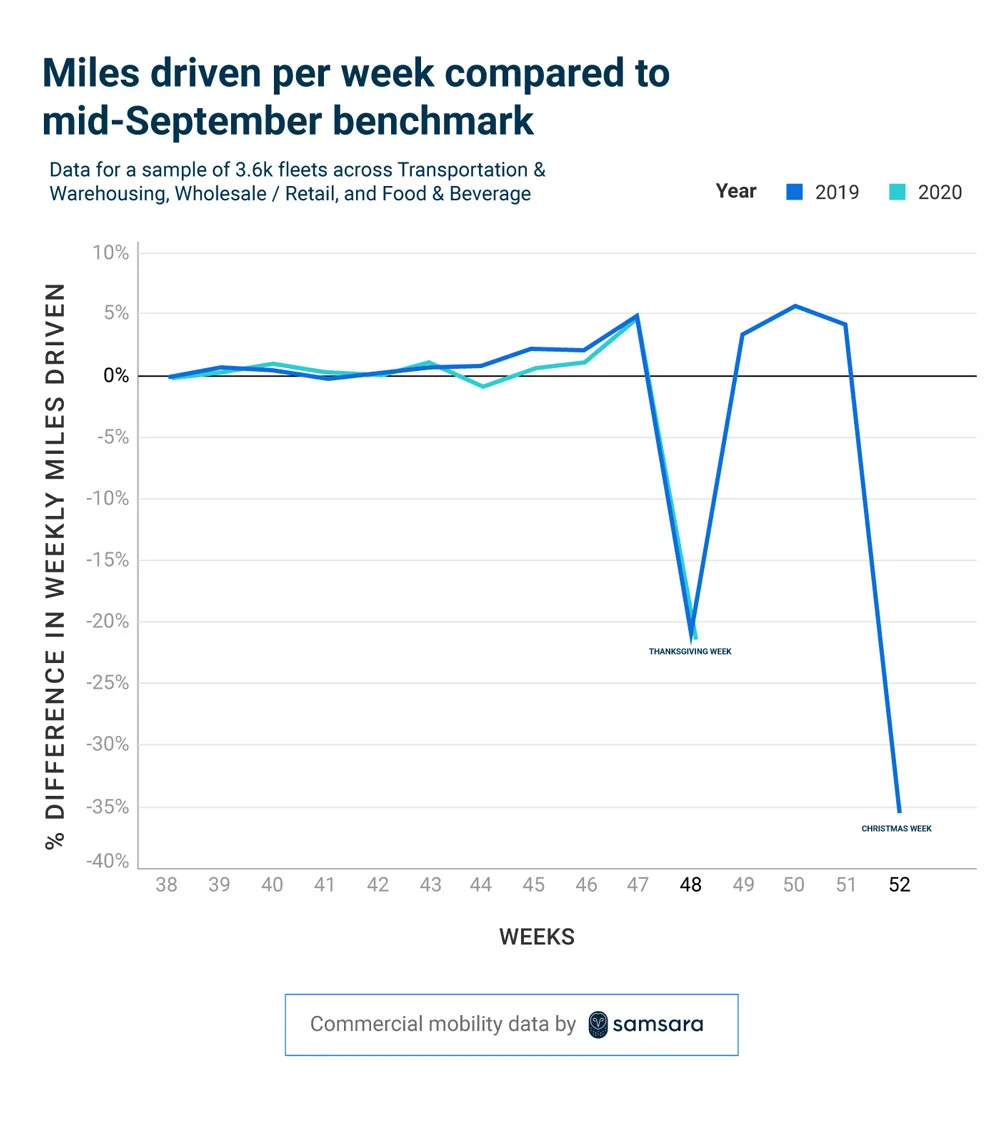
There’s no doubt about it; Thanksgiving and Christmas are an extremely busy time of year for commercial fleets in these key industries. In fact, our data shows an increase in miles driven the weeks leading up to Thanksgiving and Christmas, as these fleets rush to meet the holiday surge.
In 2019, total miles driven was about 5-6% higher in the weeks leading up to Thanksgiving and Christmas, compared to similar weeks in other non-holiday months. And just a few weeks ago, we saw a similar spike in activity before Thanksgiving 2020; from November 15 to November 21 this year, we saw a 5% increase in miles driven.
This increase in activity leading up to the holidays is no surprise, given the increased demand for groceries, gifts, and other goods as consumers prepare to celebrate. In fact, the U.S. recorded record online sales in 2019 around Thanksgiving and Christmas. This holiday season could be even busier for commercial fleets, given that 66% of shoppers say they will increase their online purchases during the 2020 holiday season.
Less-than-truckload carrier ABF Freight, a Samsara customer, has seen the impact of this surge in tonnage increases.
“Our asset-based business has seen sequential tonnage increases in almost every month through the end of November, and residential delivery shipments have increased meaningfully thanks to the surge in e-commerce,” said Seth Runser, Vice President of Linehaul Operations for ABF Freight. “We remain hopeful that these trends for logistics services will continue through the remainder of the year.”
In fact, while we saw driving activity increase roughly the same amount this year as last (about 5%) leading up to Thanksgiving, the trend has become more pronounced in 2020 for fleets in one industry: food and beverage. Food and beverage fleets saw a 6.2% increase in miles driven this year leading up to Thanksgiving, compared to only 4% last year (whereas the other two industries we analyzed show similar increases this year compared to last). This could be a result of the 2020 “grocery boom”—a huge (though slowing) spike in demand for groceries this year due to the COVID-19 pandemic—combined with the added demand of Thanksgiving.
<div id="section-3">3. Speeding tends to spike on holidays, and we predict it will spike again this Christmas</div>
Speeding has been higher overall this year since the first COVID-related lockdowns went into effect this March—but our data shows that the days most prone to speeding are actually the holidays themselves.
On Thanksgiving day 2019, for example, we saw a 4% increase in speeding compared to the November and December 2019 average. We saw an even more significant 14% increase in speeding on Christmas day 2019.
So far, we’ve seen this trend become more pronounced in 2020. This year, we saw an even larger spike in speeding on Thanksgiving day—an 9% increase compared to the November 2020 daily average—more than double the 4% increase in speeding we saw on Thanksgiving last year. Given this data, we predict we’ll see another large spike in speeding on Christmas day this year.
Increased speeding on holidays could be due to a number of factors. However, the main factor seems to be emptier roads, given that speeding also increased in March through May, when COVID-related lockdowns were in effect throughout the country. Emptier roads due to COVID-19 have been cited as the main cause of the surge of speeding among passenger vehicles this year as well.
In addition, our data shows that speeding also tends to increase on Saturdays and Sundays, as you can see in the charts above. Similar to holidays, this is likely due to less commuter vehicles on the roads.
Navigating the busiest time of year, fleets are doing more with less
Throughout 2020, economic uncertainty and demand fluctuations have made efficiency a requirement for business survival. This has led many businesses to focus on doing more with less.
Some U.S. logistics companies, including UPS and FedEx, are hiring thousands of seasonal employees. Many others are looking to technology to increase operational efficiency, meet customer demands, and keep their drivers safe during COVID-19.
ABF Freight, for example, has found that technology has been key to their success during this busy holiday season—helping them provide a best-in-class experience by “striking the right balance of human and digital interaction.”
“We believe the best way to effectively serve our customers is to intimately understand their logistics needs and be able to flex our services around their supply chain disruptions,” said Seth Runser, Vice President of Linehaul Operations for ABF Freight. “We have been able to do this thanks to investments in technology that provide a more actionable view of our customers’ specific requirements and pain points, and they have allowed us to continue to provide these services as safely as possible.”
Subscribe to our series for more data insights
Want more insights like this from Samsara? Get access to transportation trends as soon as they're released by subscribing to Samsara Data Insights.
Samsara collects more than 1.6 trillion sensor data points yearly from more than 15,000 customers across diverse industries—including transportation and logistics, construction, local government, and more. Our data science team analyzes this data to find insights you can use within your own fleet.
Subscribe now to get the latest insights delivered straight to your inbox.
Subscribe<div id="methodology">Methodology</div>
For more information about your rights, and how we may process your personal data, please see our privacy policy.
We analyzed anonymized and aggregated data for a sample of 3,676 customers across the Wholesale Retail / Trade, Food & Beverage, and Transportation & Warehousing industries. The dataset contains nearly 80,000 unique vehicles across 110 million trips taken between 9/1/2019 to 11/30/2020.
We added controls to account for key confounders unrelated to fleet operations. For example, to control for new customers signing up for the Samsara platform, we excluded any newly on-boarded customers within the time period of interest. We also excluded data from customers who may have been doing large scale installations during the period of interest.
To compare apples-to-apples, we indexed time comparison charts to either day or week of year. Given holidays and weekends can occur on different days of a given year, you will notice weekend and holiday dips to be slightly offset when comparing 2019 to 2020 data.
All commercial mobility (e.g., miles driven, vehicles on road) and speeding data is collected from our vehicle gateways. Speeding types are defined as follows:
Light speeding: 1-5 MPH over speed limit
Moderate speeding: 6-10 MPH over speed limit
Heavy speeding: 11-15 MPH over speed limit
Severe speeding: 15+ MPH over speed limit
Read more

AI reveals where and when American drivers are most distracted

Senior Data Scientist
Samsara Data Shows Government Agencies Lead the Charge on EV and Hybrid Adoption

Senior Applied Scientist
New Data Shows the Dangerous Side of Holiday Travel, Plus Tips on Staying Safe
Senior Applied Scientist
New Samsara Privacy Report: Physical Operations Leaders Embracing AI

Senior Director, Legal
For National Safety Month, See How Samsara Reduces Harsh Braking

Growth Marketing Manager


– 7 min read
Samsara Drives Cost-Savings Opportunities for Customers in Their First Year

Manager, Expansion Growth