Data Insights
Samsara data reveals how extreme summer heat drives up vehicle idling and fuel costs
August 21, 2024
Senior Data Scientist

Get the latest from Samsara
Subscribe nowMany people enjoy the summer for seasonable warmth, but this year's heat is breaking records across North America. On July 7th, Las Vegas hit an all-time high of 120 degrees and was gripped by a week-long streak of 115-plus degree days, and heat records have fallen in other cities, from Palmdale, California, to Morrisville, North Carolina. July 2024, in fact, was the hottest month ever recorded worldwide.
This summer is an unwelcome continuation of last year, when temperatures were even higher for longer. Phoenix, Arizona, endured a 31-day streak of high temperatures of over 110 degrees, and marked July as the hottest month for any U.S. city in history.
Extreme heat events can have a significant impact on physical operations, with increased risks for frontline workers. To address the danger, the Occupational Safety and Health Administration (OSHA) recently proposed a rule that, if finalized, would be the first major federal regulation of its kind to provide specialized employee and supervisor training on heat hazards as well as requirements to implement improved work practice standards, like access to shade and water and heat acclimatization for new employees. Moreover, rising temperatures can significantly drive up fuel costs, impacting organizations' bottom lines, as well as increasing emissions.
To get a deeper understanding of how extreme heat is affecting physical operations organizations, the Samsara Data Science and Analytics team examined data from tens of thousands of trips taken by commercial vehicles during three extreme heat events in Oregon, Washington, and Arizona—as well as in each of nine states that make up the Northeast region of the U.S.—in 2023 and 2024. (See below for detailed methodology). Read on to see what we discovered.
Higher temperatures lead drivers to idle more.
Idling is notorious for wasting fuel and increasing emissions, and many states and municipalities have laws to regulate idling. However, in a heatwave, letting a vehicle idle to run the air conditioning can be the only way for a frontline worker to cool down.
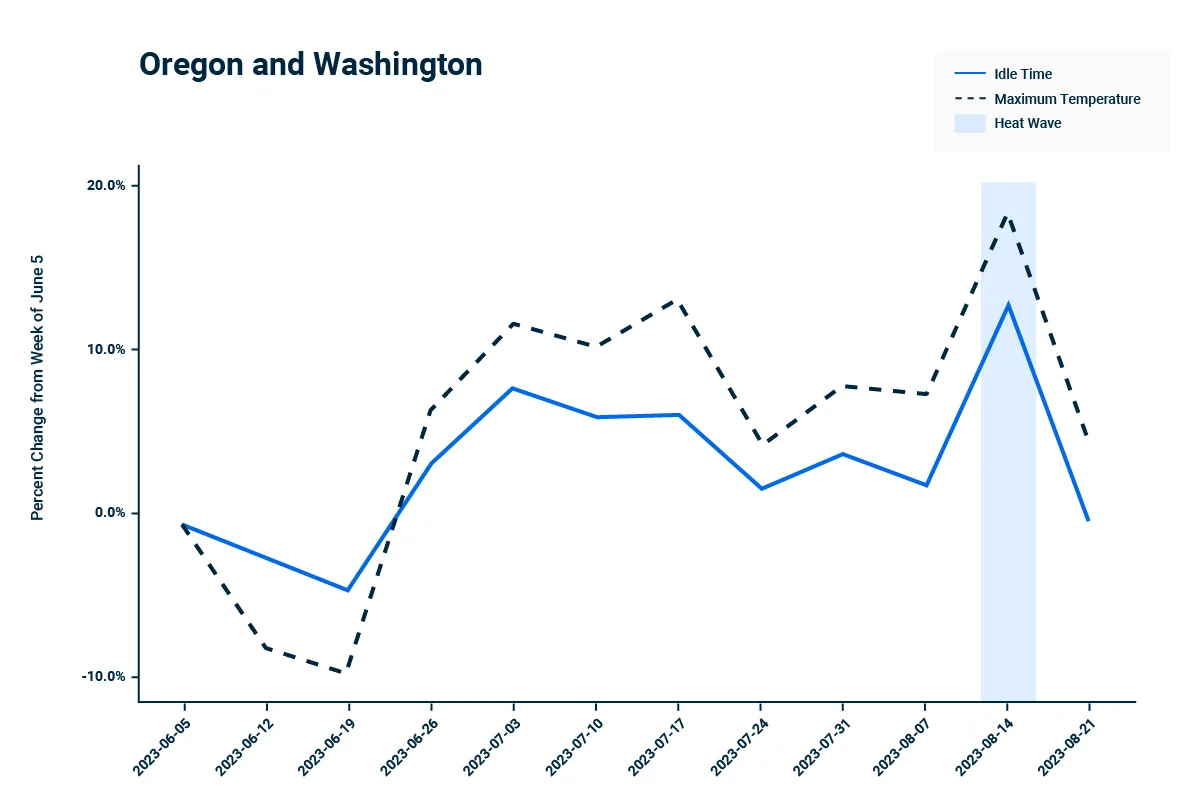
In Samsara's data, we found just that: The proportion of time drivers spend idling increases in high heat, and there is a strong correlation between idle time and maximum temperature. In fact, in the data for Arizona, 84% of the variation in idle time is potentially explained by changes in temperature, while in the Northwest, temperature explains 88% of the variation in idle time. Moreover, as temperatures rose in Arizona in July of 2023, time spent idling also went up across our customer cohort in the state, peaking at a 13.8% increase relative to the beginning of June during the week of July 17, 2023.
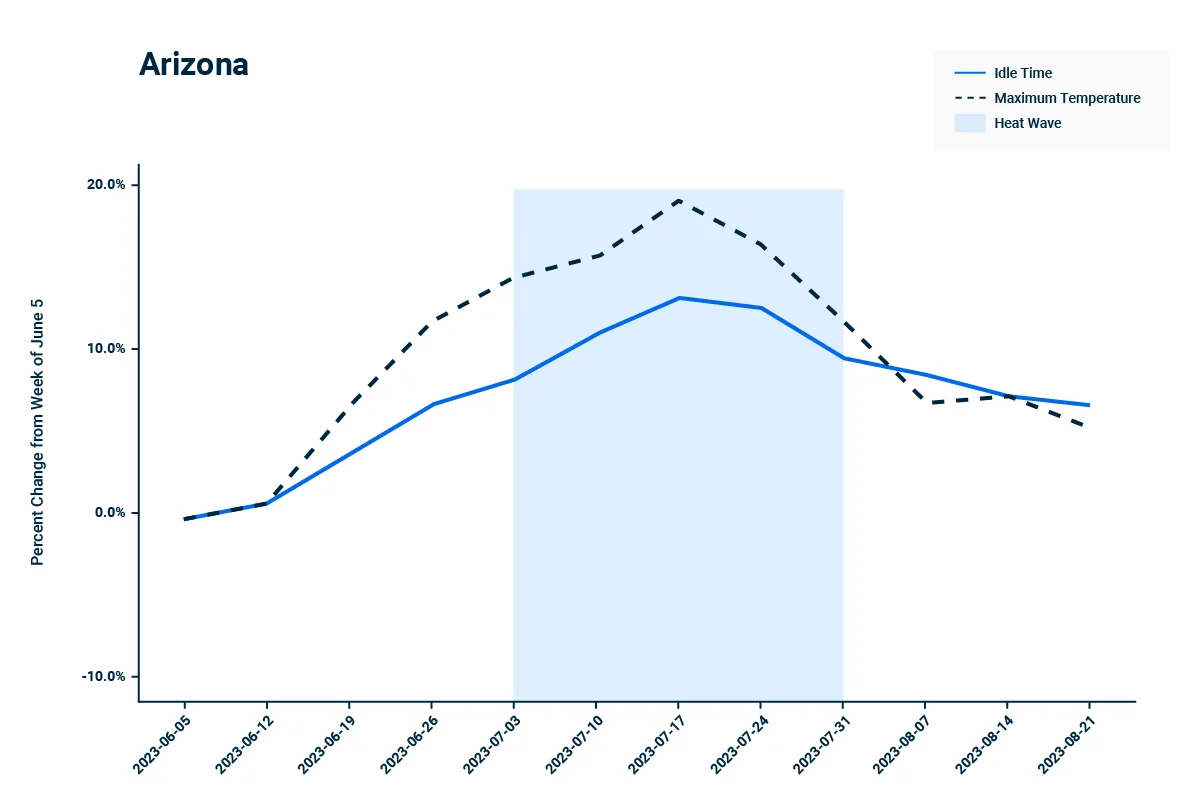
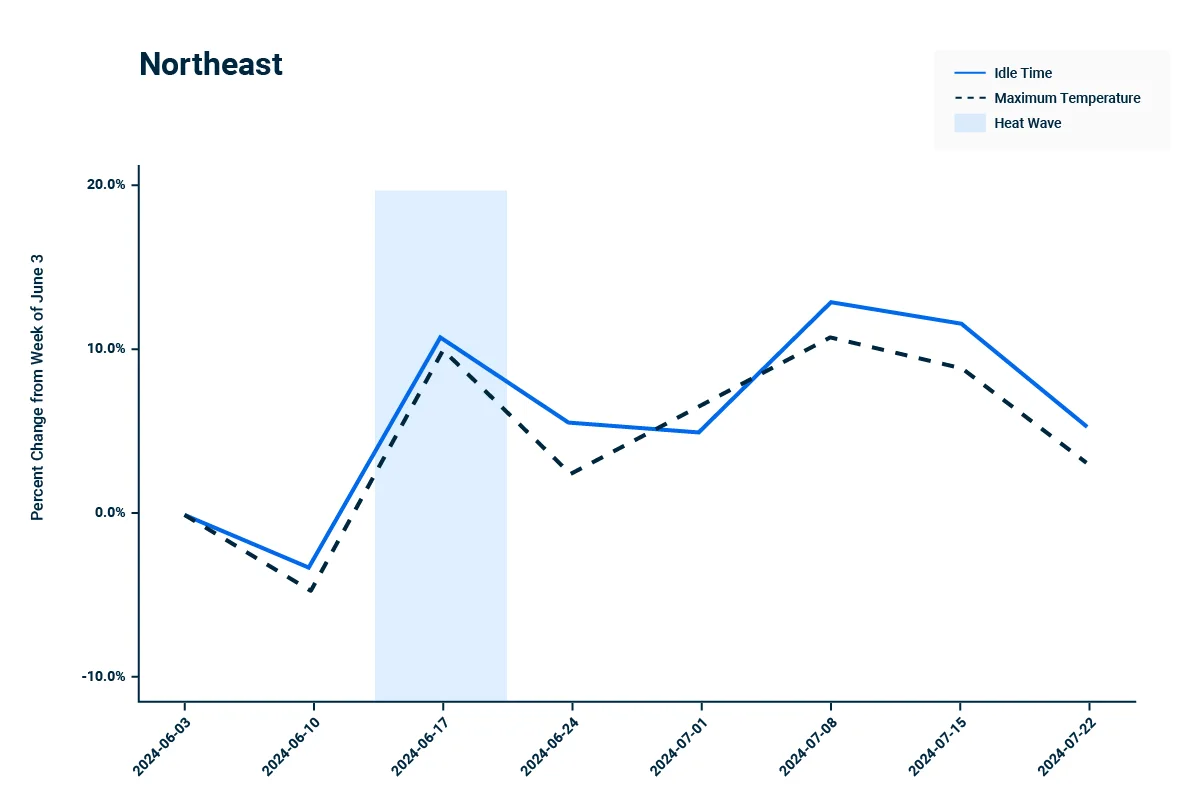
The correlation between idling and heat is even stronger in areas that aren't considered desert regions. For example, looking at data from a heat wave that hit the Pacific Northwest in 2023, we found that idling and heat moved in almost identical unison. More recently, on the other side of the country, where a heat wave engulfed the Northeast in June 2024, both heat and idling time spiked abruptly at the same time.
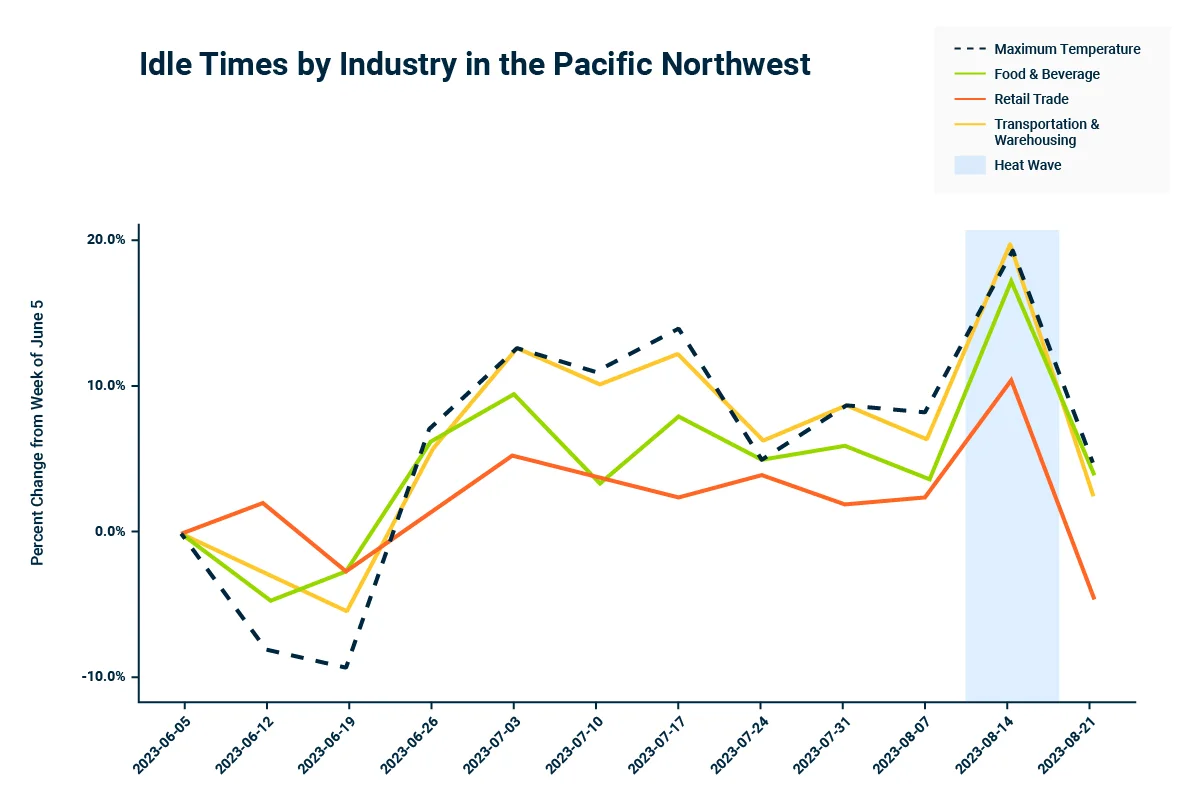
Similar trends are visible across physical operations industries. Our data shows that idling times are strongly correlated with temperature for both the food and beverage and transportation and warehousing sectors. Within retail trade, the correlation is weaker, though a spike in idle time is still observed during the week of August 14, 2023. This indicates that while goods and cargo may differ for various sectors, the impact of extreme heat is felt consistently across physical operations organizations that operate vehicle fleets.
The financial and environmental costs of heat-related idling.
All of the extra time spent idling during extreme heat events can quickly add up to significantly higher fuel costs. We estimate that large truck operators in the Pacific Northwest spent an additional $1 million in total on fuel during the unseasonably hot week of August 14, 2023. In the Northeast, large truck operators spent more than $4.25 million in total on additional fuel during one week of the June 2024 heatwave.
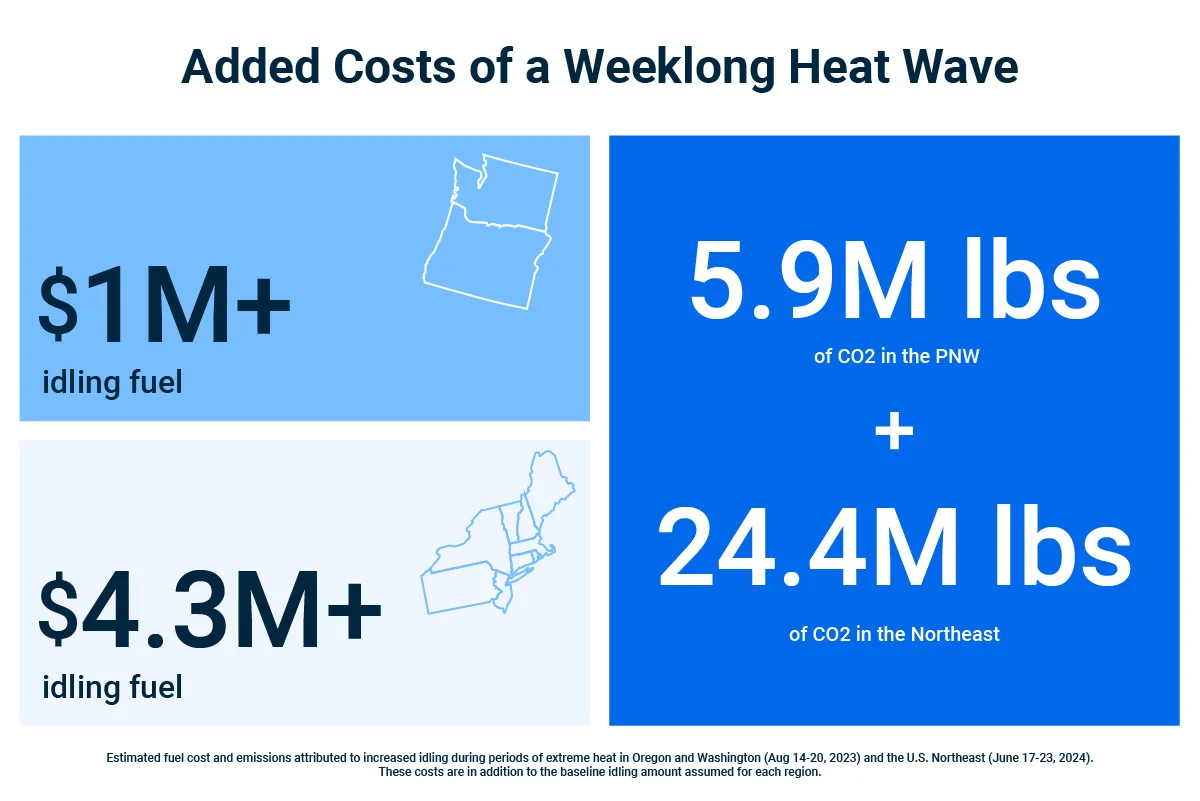
Beyond the cost of fuel, increased idling tended to increase emissions. Vehicles operating in the Pacific Northwest produced an additional 5.9 millions pounds of carbon dioxide, while vehicles in the Northeast generated 24.4 million pounds of the greenhouse gas.
Preparing for a hotter future with data.
As heat events continue to increase, finding ways to adapt is a top priority for many physical operations organizations. One company, Estes Express Lines—the largest privately-owned freight carrier in North America and a Samsara customer—is relying on data to create targeted strategies to mitigate the impact of excessive heat. "The safety of every Estes employee is paramount. As extreme temperatures become more commonplace, it's something we are accounting for in our safety planning," said Curtis Carr, Vice President of Safety & Risk Management at Estes. "With technology, we can get insights from real-time, granular data that allow us to tailor specific solutions to each idling scenario instead of applying a one-size-fits-all solution. This visibility helps us ensure worker safety, while allowing us to do our part to reduce emissions across our fleet."
The non-profit and public sectors are also taking an active role in planning for extreme heat events. The State of Arizona, for example, recently appointed a Chief Heat Officer, while the Adrienne Arsht-Rockefeller Foundation Resilience Center has developed comprehensive resources to help organizations develop heat action plans including elements such as thermal comfort policies, vehicle electrification, and idle-free zones, among many others.
It's too early to tell if 2024 will be the hottest year on record. However, physical operations organizations can take steps now to increase their awareness of how heat affects idling and fuel efficiency and proactively plan for heat events in the future. Learn how one company, Summit Materials, reduced idling across their fleet, saving an estimated $1.8 million per year in fuel costs.
Methodology
The idling time statistics shown are based on our review of anonymized historical data from Samsara customers in the United States. Each geographic analysis contains data from tens of thousands of trips taken between June and August 2023 in Oregon, Washington, and Arizona, or between June and July 2024 in each of nine Northeastern states: Maine, New York, New Jersey, Vermont, Massachusetts, Rhode Island, Connecticut, New Hampshire, and Pennsylvania.
Daily temperature data was obtained from the National Oceanic and Atmospheric Administration and aggregated to produce weekly values. To calculate the monetary cost of increases in idle time, we assumed 0.85 gallons of fuel per hour of idling and a fuel cost of $4.00 per gallon. To calculate the additional CO2 output from increased idling, we used a rate of 19.21 pounds per hour.
Get the latest from Samsara
Subscribe now


